Bitcoin’s price changes serve as a barometer for the entire crypto market. When Bitcoin’s price rises, other crypto assets often follow suit, and vice versa. Predicting Bitcoin’s price changes and analyzing the influencing factors have become a recurring topic in crypto news.
Despite the frequent inaccurate predictions, understanding what affects Bitcoin’s price remains a topic of interest, albeit often approached informally.
As these analyses become more emotionally charged rather than scientifically rigorous, discussing “what truly influences Bitcoin prices” in a serious manner becomes both scarce and challenging.
Recently, a comprehensive paper titled “What Drives Crypto Asset Prices” was published, discussing Bitcoin price influencing factors using scientific econometric models. The authors of this paper are notable figures:


- Austin Adams: Researcher at Uniswap and Variant Fund
- Markus Ibert: Former Federal Reserve economist and finance professor
- Gordon Liao: Chief Economist at Circle and former Federal Reserve economist
Given the 39-page length and complex mathematical calculations in the paper, Coindarwin has distilled and interpreted its core points in a more accessible manner to provide insights into market price trends.
Key Conclusions
- Traditional Factors Affecting the Crypto Market: Bitcoin’s price is influenced not only by internal crypto market factors but also significantly by traditional financial market factors such as monetary policy and risk sentiment.
- Dual Role of Monetary Policy: In 2020, the Federal Reserve’s loose monetary policy boosted Bitcoin prices, while the tightening policy in 2022 led to a significant price drop. Among all factors causing the price decline, the tightening monetary policy accounted for two-thirds of the impact. Without this policy change, Bitcoin’s returns might have been higher.
- Impact of Risk Premium: Since 2023, crypto asset returns have been driven mainly by a compression in the risk premium (investors’ perceived risk of BTC decreased, leading them to accept lower additional returns). This indicates a shift in the market’s risk assessment of crypto assets.
- Complexity of Daily Fluctuations: Factors such as crypto adoption and risk premium play a dominant role in explaining daily Bitcoin return changes. The impact of traditional monetary policy is more significant over longer time frames and less so on a daily basis.
- Impact of Specific Events: Case studies on events like the COVID-19 market turmoil, the FTX collapse, and BlackRock’s launch of a spot ETF confirm the short-term price impact of specific events on Bitcoin.
Methodology for Bitcoin Price Influencing Factors
When examining the price volatility of a new asset class, it’s crucial to consider two aspects: how much is due to spillover effects from the traditional financial market and how much is due to the asset’s inherent specific risks.
To explore this, the paper analyzes the daily return series of three assets:
- Bitcoin: representing cryptocurrencies
- Two-year Treasury zero-coupon bonds: representing traditional safe assets
- S&P 500 Index: representing the overall performance of the US stock market
By comparing the co-movement (the similar rising or falling trend) of these assets’ daily returns, the paper scientifically abstracts three specific factors that influence both Bitcoin and traditional asset prices:

- Monetary Policy Shocks: Changes in policy from central banks (like the Federal Reserve) impacting Bitcoin prices. For instance, lower interest rates make borrowing cheaper, encouraging investment and potentially driving up Bitcoin prices.
- Traditional Risk Premium Shocks: Related to changes in investors’ risk attitudes. For example, if most market participants are worried about risk, it could lead to a simultaneous drop in the prices of Bitcoin and other assets.
- Crypto-specific Demand Shocks: Price impacts specific to the crypto market, such as the emergence of new technologies, regulatory changes, or shifts in crypto adoption rates and sentiment.
With this framework, we can quantitatively analyze the extent of each shock’s impact and how they influence Bitcoin prices.
Skipping the detailed mathematical regression models used in the paper, we focus directly on the more comprehensible analysis and results.
What Exactly Influences Bitcoin Prices?
Bitcoin’s 2022 Plunge: 50% Attributed to Tightening Monetary Policy (Rate Hikes)
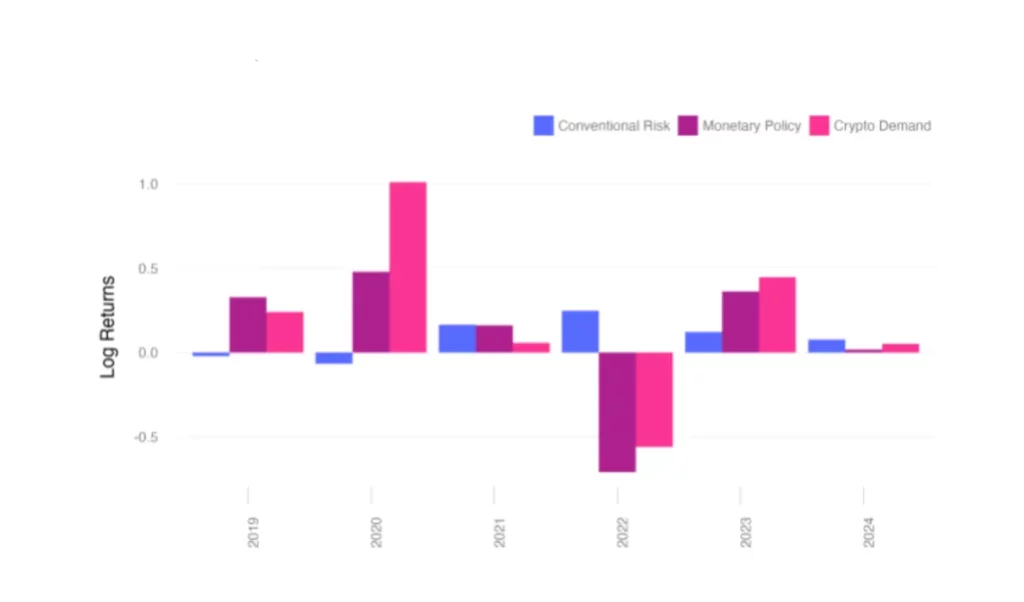
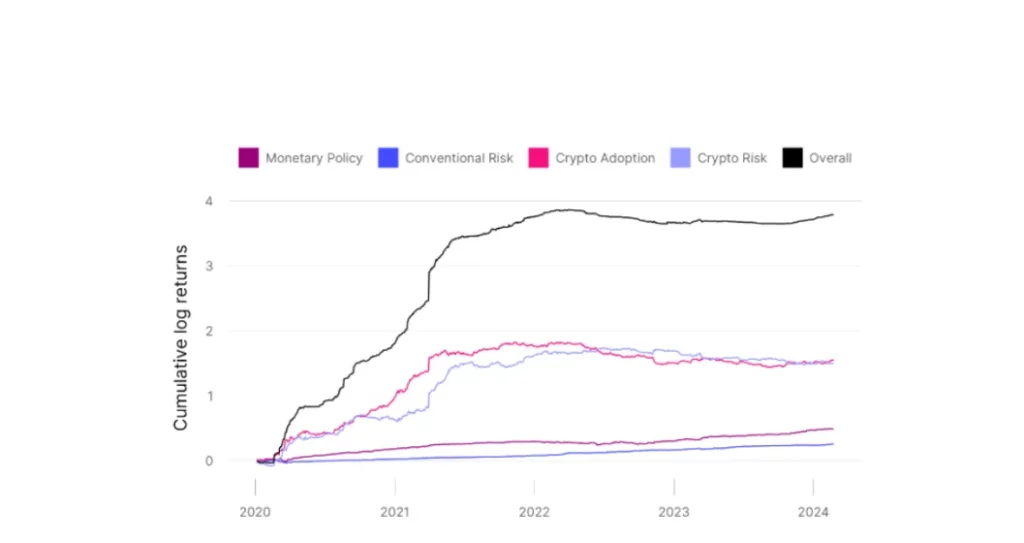
The paper analyzes the factors influencing Bitcoin’s daily price from January 2019 to February 2024.
Bitcoin’s returns can be decomposed into three structural shocks: monetary policy shocks, traditional risk premium shocks, and crypto demand shocks. (Note: you can simply understand shocks as factors affecting Bitcoin prices.)
These shocks influence Bitcoin prices differently over various periods.
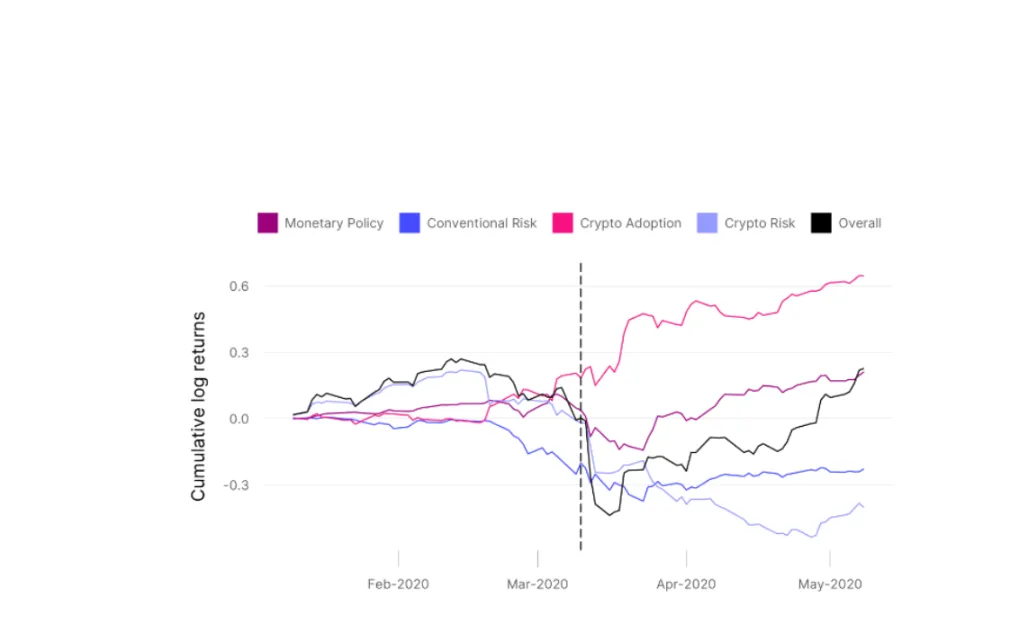
1. Market Turmoil in March 2020:
During the market turmoil triggered by COVID-19, traditional risk premium shocks were the main reason for Bitcoin’s price drop.
Bitcoin’s price fell from $8600 to $6500, a decrease of 24.2% (simple return) and 27.7% (logarithmic return).

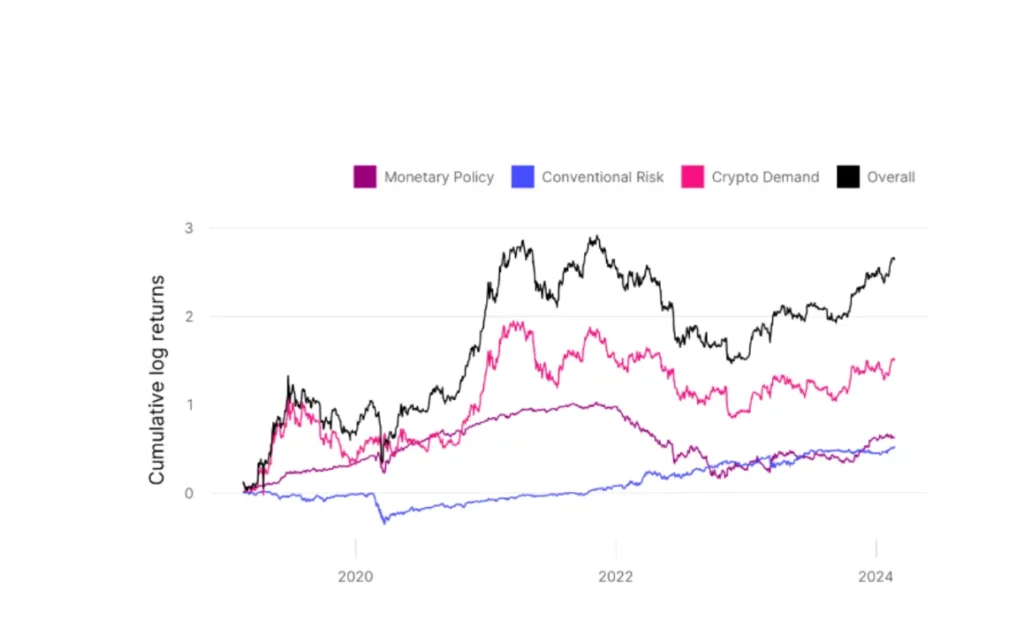
The chart shows Bitcoin’s daily return rate (black line) processed mathematically in logarithms, with other colored lines indicating the contribution of different factors to the return rate.
2. Recovery in 2020:
Subsequently, Bitcoin’s price rise was supported by the decline in traditional risk premium and loose monetary policy, though part of the rise couldn’t be explained by traditional factors, reflecting significant crypto demand shocks.
3. Price Drop in 2022:
In 2022, Bitcoin’s price decline was mainly due to negative monetary policy shocks and negative crypto demand shocks, while the decline in traditional risk premium continued to support the price.
From January 2022 to January 2023, Bitcoin’s logarithmic return dropped by about 1.02, equivalent to a 64% simple return drop.
4. Severe Impact of Tightening Monetary Policy:
The model shows that monetary policy shocks contributed about 50 percentage points to Bitcoin’s price decline. Without the impact of tightening monetary policy (e.g., rate hikes), Bitcoin’s price decline might have been only 14%.
5. Volatility Analysis:
Most of the daily changes in Bitcoin returns cannot be explained by traditional risk premium and monetary policy shocks. Crypto demand shocks account for over 80% of daily volatility.

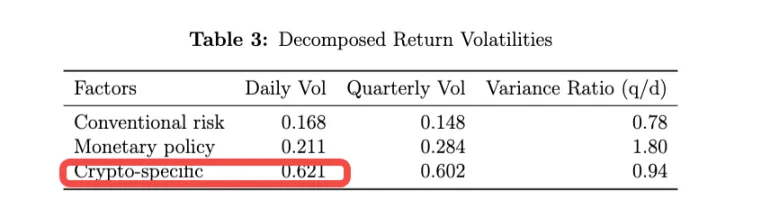
The impact of monetary policy is mainly reflected in long-term fluctuations, indicating that Bitcoin is a highly volatile asset, and its volatility cannot be explained solely by traditional asset drivers.
This section emphasizes the influence of different factors on Bitcoin’s return volatility, particularly the long-term importance of monetary policy, while also highlighting significant volatility due to internal crypto factors.
Therefore, the next part of the paper will explore the specific sources of crypto demand and how this variable affects Bitcoin’s price in more detail.
Price Surge in 2021 Due to Increased Crypto Adoption
Followed by Decreased Investor Demand for High BTC Returns.
When analyzing crypto demand itself, the authors refine this influencing factor into:
- Crypto market adoption (such as new technologies/narratives, market sentiment) and
- Crypto market risk premium (the extra return investors require for taking on additional risk).
These two points also jointly affect changes in Bitcoin’s returns and the scale of the stablecoin market.
1. Growth from 2020 to 2021:
The model indicates that Bitcoin’s price rise from 2020 to mid-2021 was mainly due to increased crypto adoption.
During this period, the prices of both Bitcoin and stablecoins experienced significant growth, reflecting higher market acceptance of cryptocurrencies.
2. Changes in 2022:
Since late 2022, the growth of stablecoins has slowed and even declined at times. This led to negative crypto adoption shocks in Bitcoin’s price decomposition, indicating decreased interest and demand for Bitcoin, and a corresponding drop in stablecoin demand.

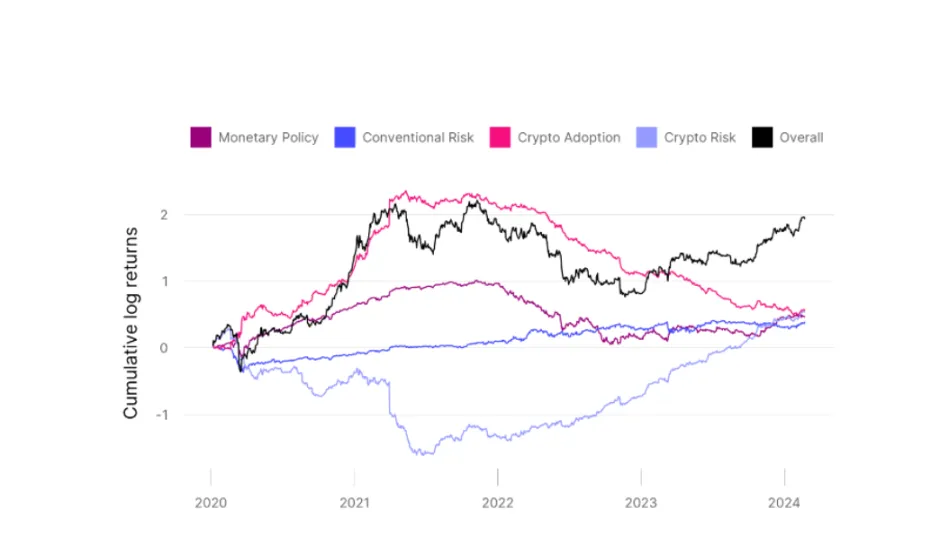
3. Continuous Compression of Crypto Risk Premium Since 2021:
In Chart above, the light blue line represents “Crypto Risk”:
In mid-2021, this line dropped significantly, indicating a sudden increase in the risk premium (investors became more concerned).
From late 2021, the line began to rise slowly but steadily. This rising trend is known as “risk premium compression.”
The rising line means risk is decreasing, and investors no longer demand such high extra returns.
4. Stablecoin Growth from 2020 to 2022:
During this period, stablecoin growth was mainly driven by the development of the crypto market. In the chart, the pink line (representing “Crypto Adoption”) was relatively high until early 2022, indicating that crypto adoption was the main driver of stablecoin growth.
From 2022 onwards, the chart shows that the blue line (representing “Conventional Risk”) started to rise and surpassed other factors. This indicates that traditional financial market risk factors began to drive stablecoin inflows.
Traditional risk factors may include stock market volatility, economic uncertainty, inflationary pressures, etc. When these risks increase, investors might seek stablecoins as a safe haven asset.

Bitcoin Price Influencing Factors Verified Through Various Events
COVID-19 Pandemic:
- Market Turmoil Background: Between January and May 2020, due to the impact of COVID-19, Bitcoin returns significantly declined in March 2020, while the stablecoin market size dramatically increased. At this time, the market was described as being in a “risk-averse” phase, with asset price declines exceeding what could be explained by fundamental changes.
- Stablecoins as Safe Havens: The growth of stablecoins during this period indicates that they acted as a safe haven within the crypto asset market, attracting investor inflows. This validates the researchers’ hypothesis that stablecoins can offer a relatively safe investment option amid market uncertainty.
- Risk Premium Shocks: Investors’ risk requirements for traditional assets (such as stocks and bonds) increased, causing these asset prices to decline. Similarly, investors’ risk requirements for crypto assets (like Bitcoin) also increased, leading to a drop in their prices.

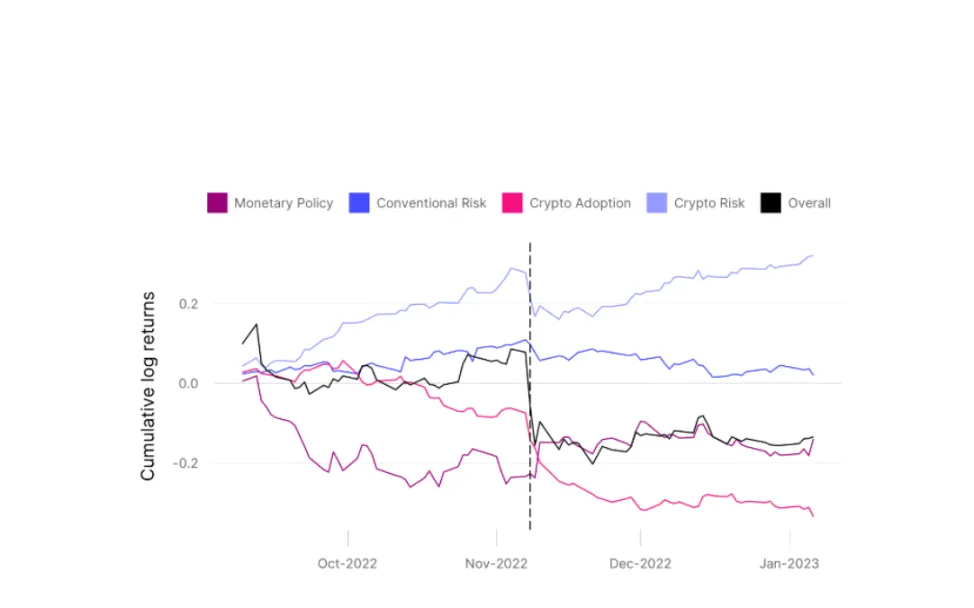
FTX Collapse:
- Market Turmoil Background: When FTX collapsed in November 2022, Bitcoin prices significantly dropped. The stablecoin market size saw a brief increase during the FTX collapse, indicating that stablecoins were still perceived as safe havens during market turmoil.
- Market Reaction Differences: Following the FTX collapse, the crypto market experienced substantial volatility, while the traditional market showed relatively minor price changes. This suggests that the crypto market was more sensitive to the FTX event.
- Crypto Market Dominance: During the FTX collapse, the crypto market shocks were dominant, particularly positive risk premium shocks (increased investor risk requirements for crypto assets) and negative adoption shocks (declined investor confidence in crypto assets). In contrast, the impact of traditional market shocks was smaller.

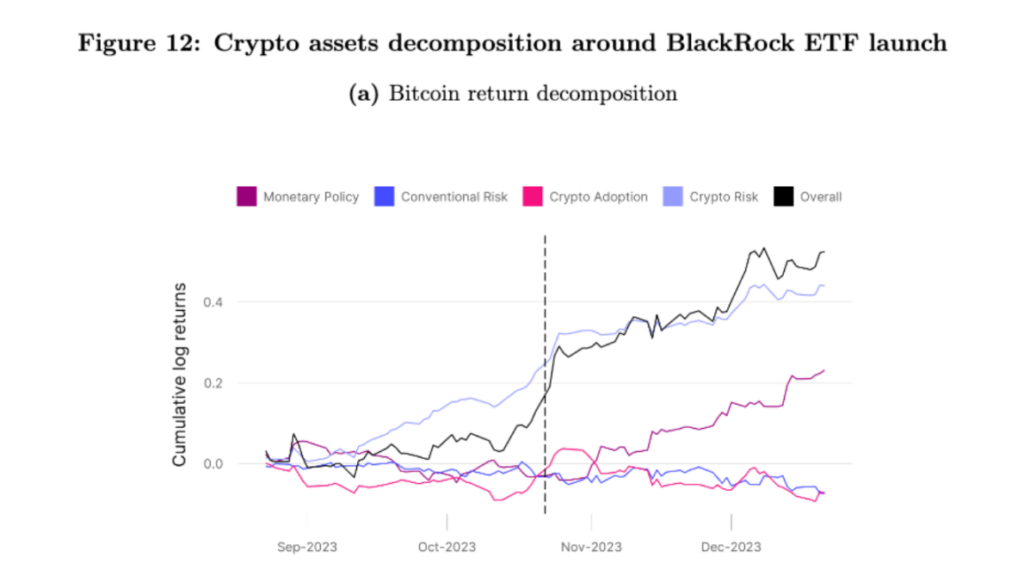
BlackRock ETF Launch:
- Market Warm-Up Background: After BlackRock announced its application for a Bitcoin spot ETF, Bitcoin returns significantly increased. This event marked a significant shift in investor sentiment and market dynamics.
- Influencing Factor Analysis: The model identified two major influencing factors:
- Positive Crypto Adoption Shocks: This reflects increased market acceptance and investor interest in Bitcoin, particularly due to the legitimacy brought by the participation of large institutions like BlackRock.
- Negative Crypto Risk Premium Shocks: This indicates a reduction in investors’ perceived risk of Bitcoin, leading to lower required additional returns, suggesting a decreased risk perception of investing in Bitcoin.
- Reasons for Bitcoin Price Increase: From September to December 2023, the rise in Bitcoin prices was mainly attributed to the decline in these risk premiums.

From the above three examples, it can be seen that these findings emphasize the profound impact of major market events (such as the involvement of large institutions) on the crypto market, particularly in terms of adoption dynamics and risk assessment.
-

-

-

-

-

-

-

-