Investing in Layer 2 vs. ETH: Which Has a Brighter Future?
Layer 2 vs. ETH
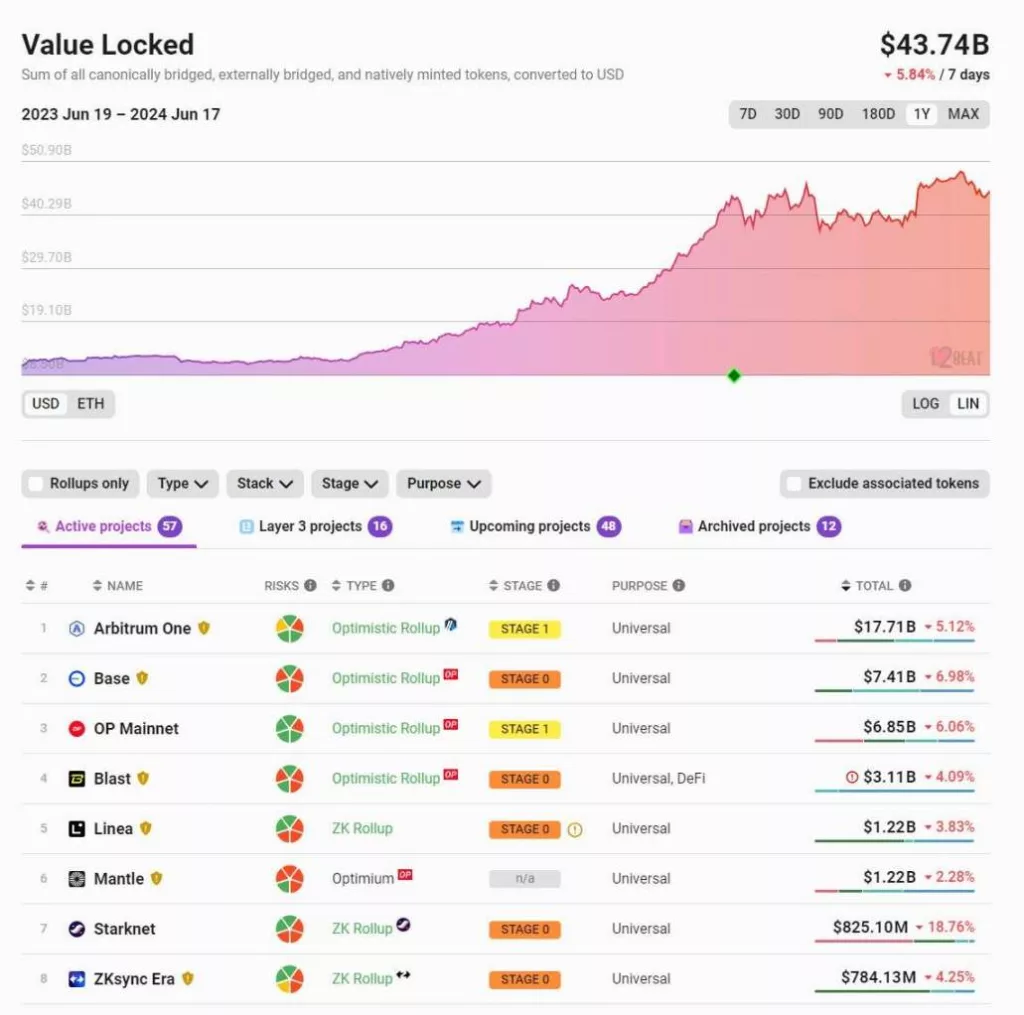
In recent years, Layer 2 (L2) solutions on Ethereum have made significant progress. Currently, the total value locked (TVL) in Ethereum L2s exceeds $40 billion, up from just $10 billion a year ago. On @l2beat, you’ll find over 50 L2 projects, but the top 5-10 projects account for more than 90% of the TVL.
After the implementation of EIP-4844, transaction fees have significantly decreased, with fees on platforms like Base and Arbitrum even dropping below $0.01.

Despite the significant technical advancements and increased usage of L2s, L2 tokens have generally performed poorly as liquid investments (though they have done well as venture capital investments). You can find numerous jokes and anecdotes about L2 tokens underperforming relative to ETH.
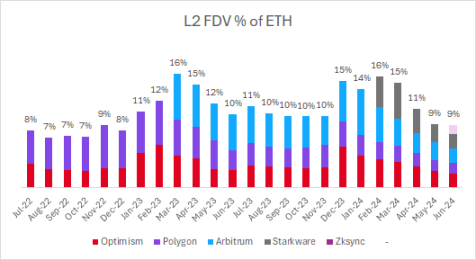
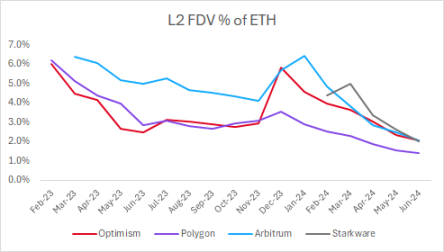
We reviewed the valuation of major L2s relative to ETH. A notable observation is that despite the increase in the number of listed L2s, their total fully diluted valuation (FDV) as a percentage of ETH remains constant.
Layer 2 FDV % of ETH
Two years ago, the only listed L2s were Optimism and Polygon, whose FDV was 8% of ETH. Today, with the addition of Arbitrum, Starkware, zkSync, and other L2 projects, their FDV is 9% of ETH.

Every new L2 token listing actually dilutes the valuation of previously listed L2 tokens.

Investing in L2 tokens has resulted in significant underperformance relative to ETH. The returns over the past 12 months are as follows:
- ETH: +105%
- OP: +77%
- MATIC: -3%
- ARB: -12%
For a long time, the major L2 tokens’ FDV has been around $10 billion. To some extent, this is quite arbitrary, and market participants have no strong reason to explain why it is $10 billion instead of $2 billion or $3 billion. Ultimately, there is significant supply pressure due to liquidity demand and/or large unlocks.
Monthly L2 Fees
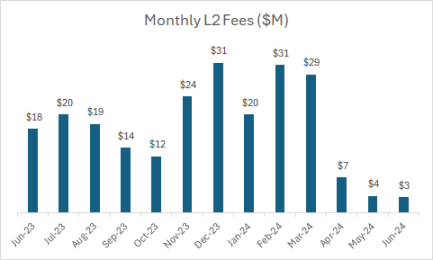
The aforementioned L2s generate $20 million to $30 million in fees per month. Since the implementation of EIP-4844, fees have dropped to $3 million to $4 million per month, with annualized fees of about $40 million to $50 million.

Currently, the total FDV of major L2 tokens is about $40 billion, with annualized fees of $40 million, resulting in a valuation multiple of around 1000x.
This stands in stark contrast to large DeFi protocols, which typically have valuation multiples between 15x and 60x (based on last month’s annualized fees):
- DYDX: 60x
- SNX: 50x
- PENDLE: 50x
- LDO: 40x
- AAVE: 20x
- MKR: 15x
- GMX: 15x
With more L2 projects listing, the FDV of L2 tokens may continue to be under pressure and diluted. The market is oversupplied, and the liquid market struggles to support it easily.
Conclusion
In the long run, L2s might generate substantial fee revenue. L2s generate $150 million in fees annually (including Base, Blast, Scroll), and this number could significantly grow as L2 activity increases.
The above observations are not targeted at specific L2 projects but are broad observations about the entire category. Buying a basket of L2 tokens at around $40 billion FDV and around $40 million fees (1000x multiple) and expecting them to outperform ETH in the long term seems difficult.
Clearly, there is no shortage of block space between L2s and high-throughput chains (like Solana, Sui, Aptos, etc.). The limiting factor is the applications using this block space. I hope that more focus will be placed on the application layer in the future and that the liquid market will reward the application layer rather than the infrastructure layer in the coming years.
In the previous cycle, it was more common for projects to list much earlier. MATIC listed in the liquid market with an FDV below $50 million, and it has now surpassed $5 billion, growing more than 100x. However, this is not the case for recent $OP, $ARB, $STRK, $ZK, and most other L2 tokens that will likely eventually list.