

INJ Price Analysis: Is an Adjustment Imminent?
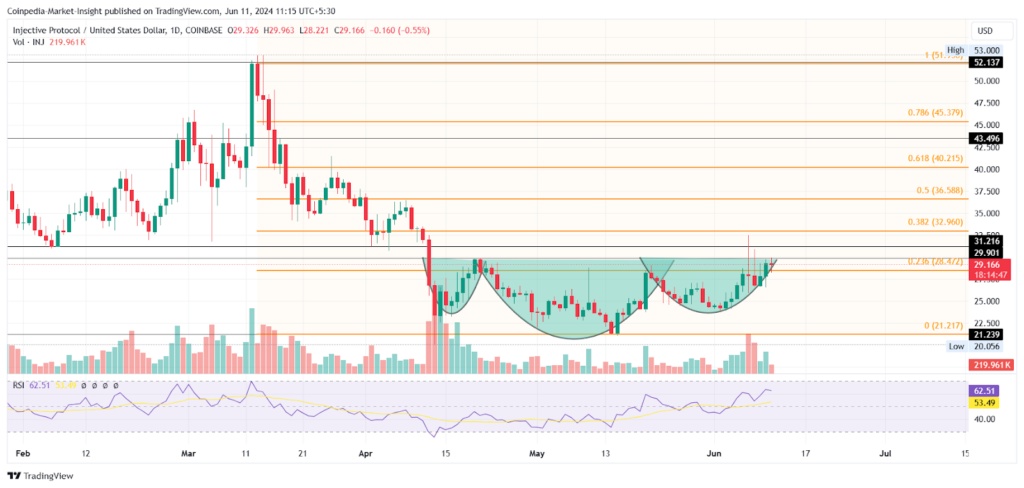
Daily Chart Shows Sideways Movement with Bullish Reversal Sentiment
The INJ price is currently trading 45% below its all-time high, indicating significant upward potential. As the overall market improves, INJ shows a recovery bounce momentum.
Bullish Pattern Indicates 35% Upside Potential
Market Cap & Recent Performance: INJ’s market cap is $2.75 billion, with a 7.5% increase in the last 24 hours and a 25% rise over the past ten days.
Head and Shoulders Pattern: The neckline is at $30, suggesting a bullish trend.
Current Price & Indicators
Trading Price: INJ is at $29.508, up 0.62%.
EMA: The 50D and 200D EMA indicate a bullish crossover.
RSI: The daily RSI shows increased buying pressure.
Potential to Reach $40
Bullish Scenario: If INJ stays above $30, it could reach $40, corresponding to the 61.80% Fibonacci level.
Bearish Scenario: If bears dominate at $30, the price may fall to $21 support.