
Key Points:
- AAVE’s market cap is $2.3 billion, with a fully diluted valuation (FDV) of $2.46 billion. Monthly circulation increases by 43,000 AAVE.
- On-chain data shows that funds from the U.S. timezone dominate AAVE holdings.
- Most large AAVE holders are in profit, but overall profitability is low. Most significant holders are not from the 2021 bull market, as many tokens have changed hands.
- Addresses increasing AAVE holdings represent substantial funds from powerful investors.
1. Overview of AAVE
1.1 Total Supply and Circulation:
AAVE has a total supply of 16 million tokens. As of now, 14.93 million are in circulation, with a market cap of $2.3 billion and FDV of $2.46 billion.
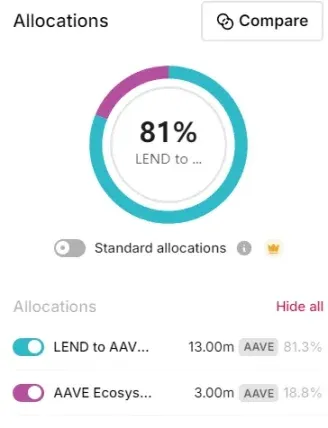
1.2 Token Distribution:
AAVE’s distribution includes 13 million tokens converted from LEND and 3 million allocated for ecosystem incentives. Monthly circulation increases by 43,000 tokens, with part used for staking rewards and part for the founding team’s rewards.
1.3 Genesis Wallet:
The founding wallet still holds 790,000 AAVE, valued at $12.2 million.

2. On-Chain Token Distrib
2.1 Top 10 Holding Addresses:

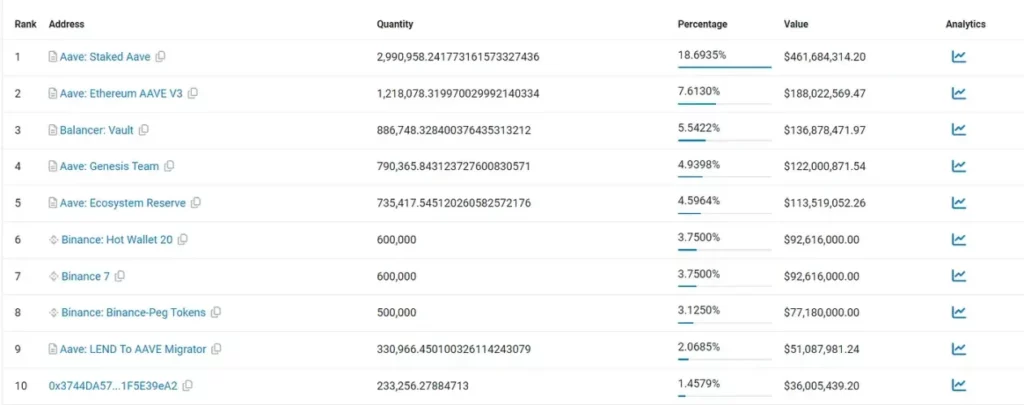
The largest holding address is the AAVE staking address with 2.99 million AAVE. Most addresses in the top 20 are cold wallets from projects and exchanges. Notable addresses include:
Address 9 Holds 330,000 AAVE from LEND migration, valued at $5 million. This portion is likely considered lost due to the long time since migration.
Blockchain Capital Holds 233,000 AAVE, remaining largely unliquidated since their investment.
2.2 Overall Token Distribution:

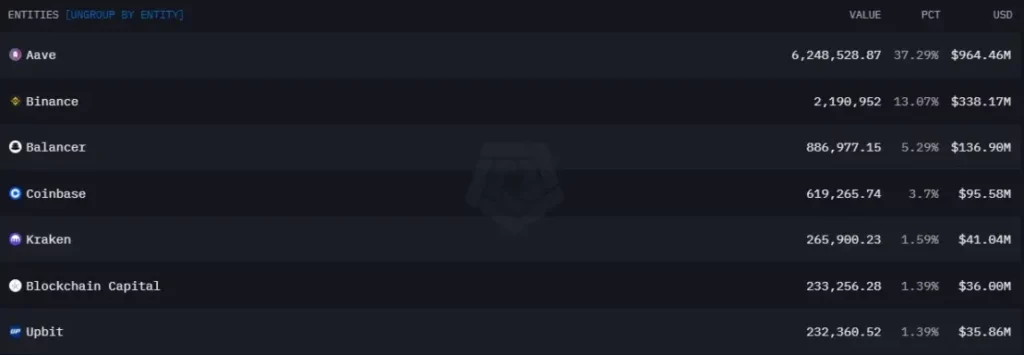
Project teams hold 37.29% of AAVE, including staking tokens owned by users. Binance has 2.19 million AAVE (13.07%), with other significant holdings in Coinbase, Kraken, and Upbit.
AAVE’s main on-chain liquidity is in Balancer with 880,000 AAVE and $170 million in liquidity, and $13 million in Uniswap.
2.3 Staking Overview:
- Staking Amount: AAVE’s staking volume has remained between 2 to 3 million. After starting staking in 2020, it peaked at 3.6 million in February 2021.
- Market Impact: Staking amounts declined during the 2022 bear market, falling from 3.17 million to 1.97 million, and have shown some decreases in 2023.
- Recent Trends: As of May 2024, AAVE’s staking has risen again to 2.99 million.
3. Exchange Token Analysis

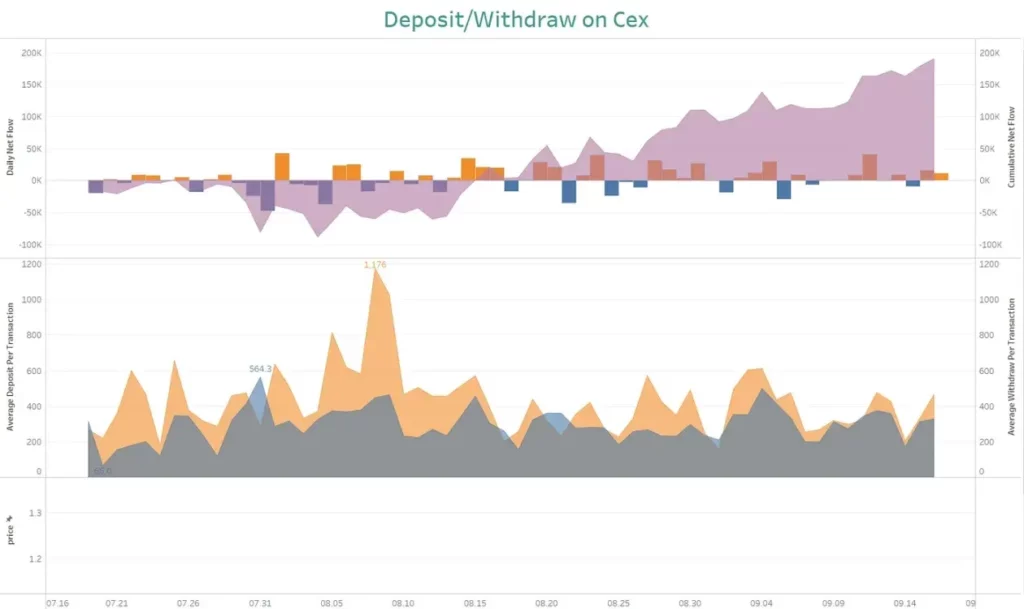
The first chart shows daily exchange deposit/withdrawal patterns, with yellow indicating net deposits and blue net withdrawals. The second chart reflects average transaction sizes, distinguishing between large and retail investor behavior.
Exchange Flow: From August 4 (-89,000 AAVE) to September 16 (+190,000 AAVE), net inflow was about 280,000 AAVE. However, this includes Coinbase, where AAVE held in custody should not count as user deposits.
Average Deposit Size: Single-coin deposits exceed withdrawals, with a maximum average deposit of 1,176, indicating large investor activity.
Excluding Coinbase, AAVE saw a net outflow from other exchanges, dropping from 3.45 million to 3.28 million, a net decrease of 170,000.

Activity Timing: CEX activity peaked at UTC 15:00, 16:00, and 17:00, aligning with U.S. activity patterns. DEX activity peaked at UTC 21:00, with overall transfer activity higher on exchanges, driven by U.S. funds.
4. Deep Analysis of Major AAVE Holders
Please note that the major holders discussed here exclude addresses belonging to projects, DEX, CEX, MEV, and intermediary wallets. These holders may include institutions.

The following summarizes the key information about major holders.
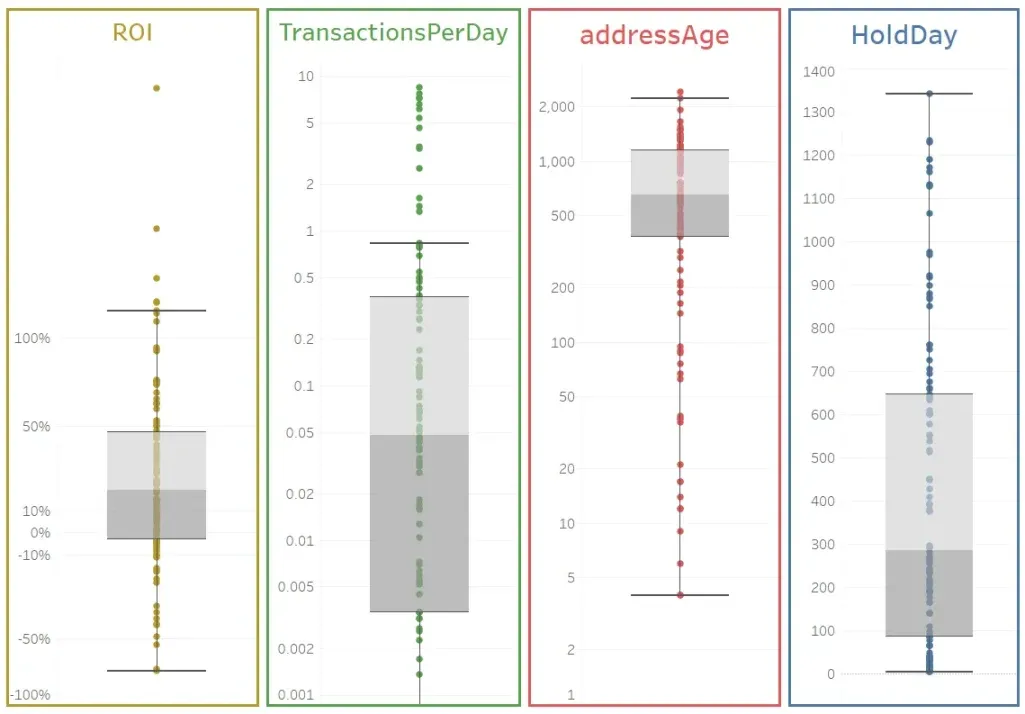
4.1 ROI Analysis:
Over 75% of major holders are in profit, although the profits are modest, with a median profit of 20% and a maximum of 137%. However, 26% are experiencing losses, with the largest loss at 66%. AAVE’s price peaked at $668 during the 2021 bull market and fell to $49, indicating that most tokens have changed hands significantly.
4.2 Hold Duration:
The median holding period (HoldDay) is 287 days (about 9 months), indicating that over half of major holders purchased their tokens this year. Only 25% have held for over 647 days (more than a year), with the longest holder at 1,342 days.
4.3 Transactions Per Day (TPD):
The median TPD for AAVE major holders is 0.048, equating to an average of 1-2 transactions per month. This suggests that large AAVE holders are not engaging in frequent trading, contrasting with current on-chain trends focused on meme coins.
4.4 Address Age:
The median age of wallets is 654 days, with over 75% of wallets existing for more than 1,147 days. This indicates that most wallets are not newly created and have been active for a while.
Overall, AAVE’s major holders predominantly consist of wallets active for over 9 months, with low daily transaction activity. While many are in profit, the overall gains are modest. Most major holders are not from the 2021 bull market, as many tokens have already changed hands.
4.5 Further Research on Major Holder Costs

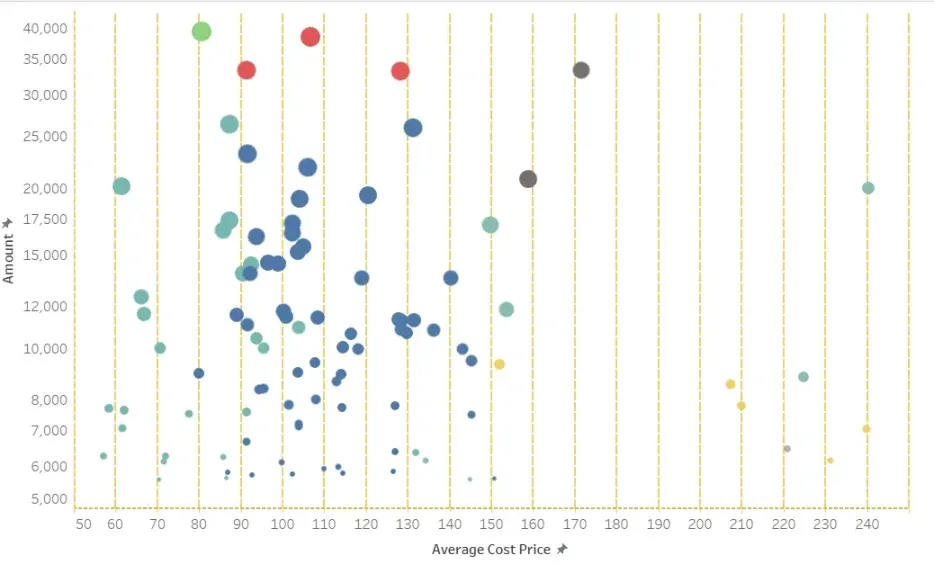
The chart illustrates the relationship between major holders’ costs and their holdings. Key observations include:
- Average Holding Costs: Most large holders’ average costs are concentrated between $85 and $150, particularly around $100, which is the recent trading range. Holders within this range include various quantities, from 6K to 35K.
- Cost Gaps: There is a notable gap in the cost range of $200. Since April 2022, AAVE’s price has remained below $200, suggesting that these holders have not traded for a long time. This group holds relatively few tokens, with the largest holding around 20K.
- Low-Cost Holdings: A segment of holders purchased AAVE at prices below $70, achieving significant returns, but this group represents a smaller overall percentage.
5. Analysis of Recent 60-Day Accumulation by Major Holders
Note: Accumulating holders refer to addresses that have recently purchased additional tokens, which may overlap with existing major holders.
5.1 Accumulation Volume Distribution

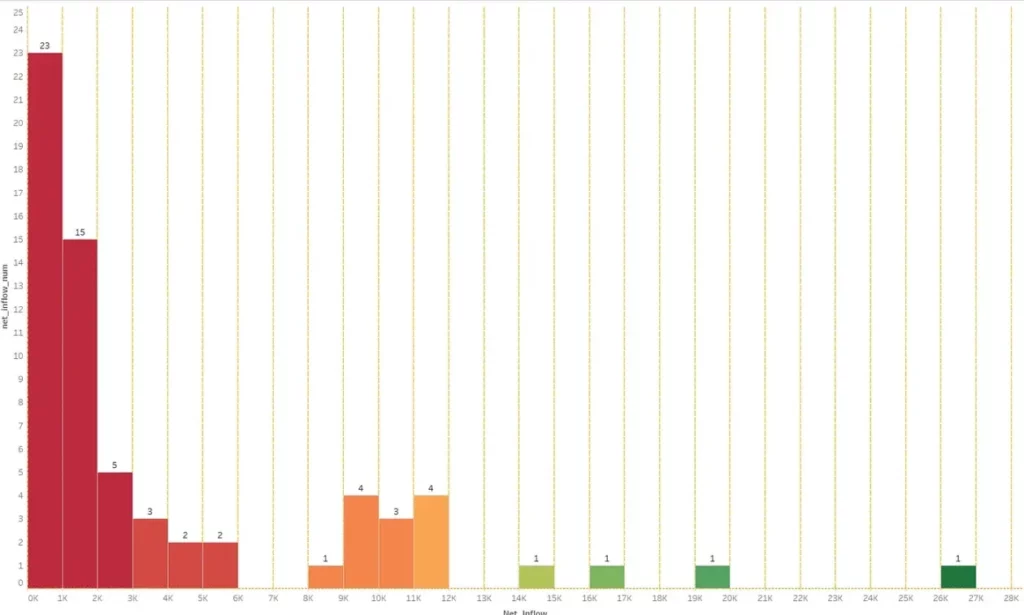
The chart shows accumulation over the past 60 days. The largest accumulation volume is in the range of 0K-1K (about $140,000) with 23 addresses. There are 15 addresses accumulating 1K-2K. For 2K-12K, various addresses are represented, but only one address has accumulated over 14K, with the largest address accumulating around 26K, valued at approximately $4 million.
5.2 Overview of Accumulation Addresses

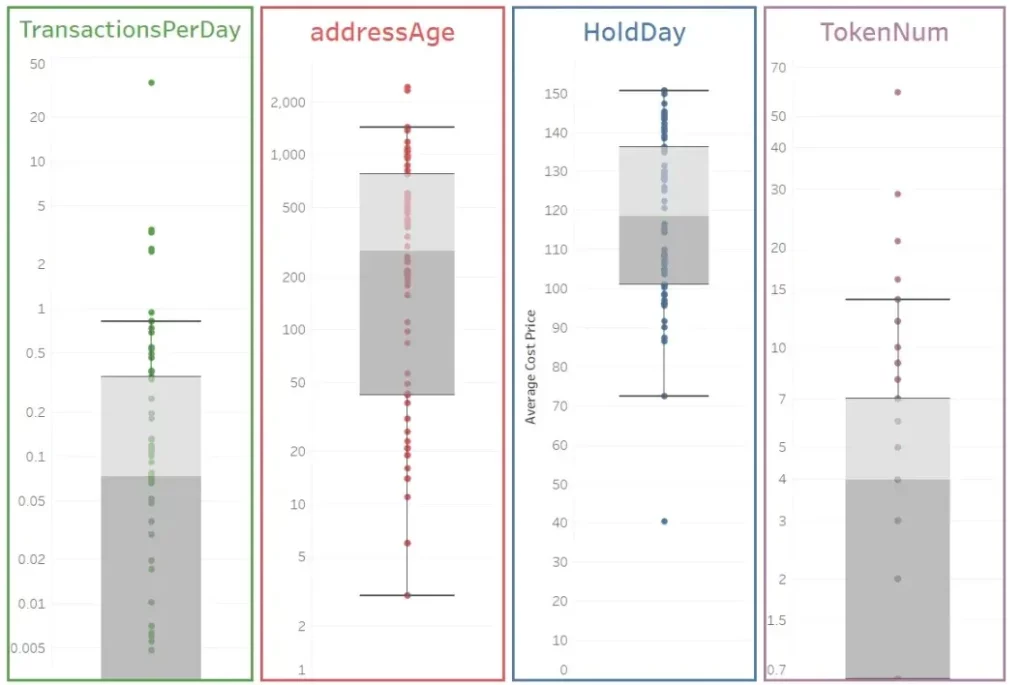
- Holding Duration: The median address age is 281.5 days, indicating that over half of the accumulating holders created their addresses within the past year. Additionally, 25% of accumulators are newer addresses (under 42 days). Compared to major holders, their average age is significantly lower (654 days), indicating that recent accumulators are new entrants.
- Daily Transaction Frequency: The median TPD for these addresses is 0.0731, translating to about 2 transactions per month. This low frequency suggests that these accumulators are not frequently engaged in on-chain activities, preferring to hold long-term.
- Token Holdings: The median number of tokens held by accumulators is 4, including AAVE. This implies that 50% of accumulators hold fewer than 3 other tokens, with 25% holding only AAVE.
5.3 Total Asset Situation of Accumulators

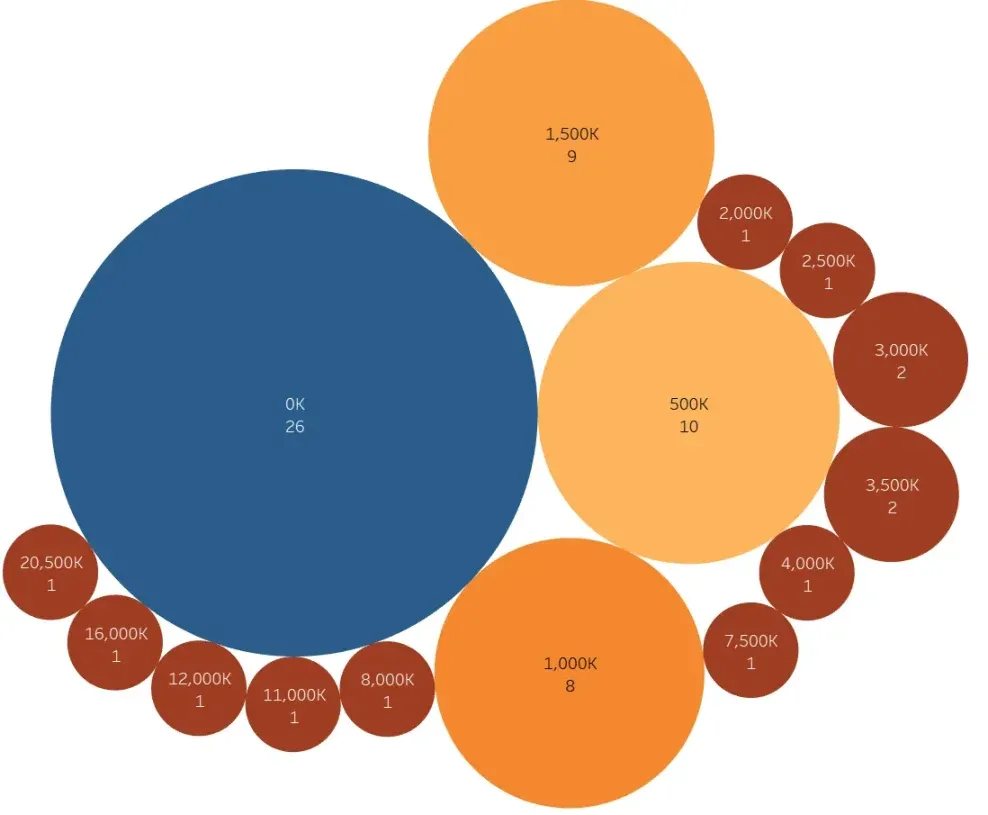
The asset distribution among accumulation addresses indicates their financial strength. The distribution across asset ranges shows 26 addresses in the $0-$500K range, 10 in $500K-$1M, 8 in $1M-$1.5M, and 9 in $1.5M-$2M. This indicates that AAVE accumulators generally hold significant funds, with the largest address holding $20.5M.
5.4 Accumulators’ Holding Composition

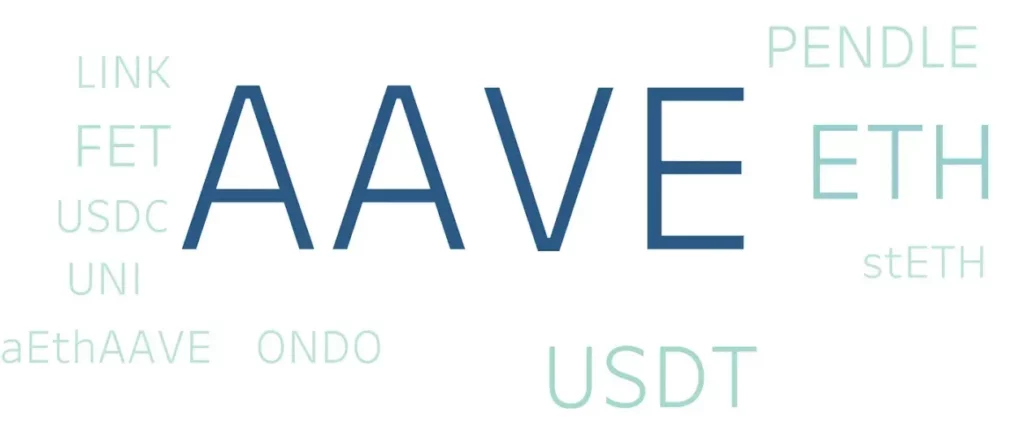
The chart reveals that AAVE is the primary holding for accumulators, which is expected. The second and third largest holdings are ETH and USDT, respectively. Other tokens held include ONDO, USDC, UNI, FET, LINK, PENDLE, stETH, aETH, and USDT. This distribution indicates that accumulators prefer established projects over the latest trends.
-

-

-

-

-

-

-

-